|
Thursday, January 31, 2019
Action Insight Daily Report 2-1-19


The January Effect
| Insight after the bell
By Caleb Silver, Editor in Chief Thursday's Headlines 1. January ends with best performance since 1987 Markets Close
 Markets Today Stocks meandered today, coming off of yesterday's Fed-induced rally with no real catalyst to rise or fall - except for tech stocks. The Nasdaq jumped nearly 1.4% today, led by Facebook, which climbed nearly 11% as investors plowed back into the original social network following the company's blowout earnings results announced on Wednesday. As we close out the month, it has been a January to remember.
Amazon.com reported earnings after the close today, beating analysts expectations, albeit slightly. Still, the e-commerce giant pulled in $72.4 billion in the fourth quarter and $232.9 billion for the year. That's insane! It was the first time Amazon crossed the $200 billion a year mark for sales, but I guarantee it won't be the last. AWS, Amazon Web Services, its cloud business, is the fastest growing business inside the company. It generated $7.4 billion for the quarter and is growing at 45% a year.
Ready for February? Given that we are at month's end, we are going to experiment with a look-ahead to February and what to expect for markets and the macro economy. We hope you like it.  You may not like that chart. Apologies. Neither do I. But history has shown that February can be a cruel month for stocks. According to LPL Financial, markets have basically been flat on average for the month of February, going back 50 years. Only June and September performed worse over that stretch of time. Does that mean it will happen again? Who knows, but we do know that past performance is no guarantee of future returns.
Ryan Detrick, the Senior Market Strategist for LPL puts it this way:
"We like to say that the easy 10% has been made off the lows and the next 10% will be much tougher...Things like Fed policy, China uncertainty, and overall global growth concerns all will play a part in where equity markets go from here."
We are all familiar with those challenges as they have been front and center for several months. The Fed has pledged patience as of yesterday. China is a big question mark and global growth is still in question. A China/U.S. trade resolution will help the global growth picture since the countries rely heavily on each other and dozens of other countries rely on these two biggest economies in the world playing nicely in the sand box.
(James has more on the key indicators to watch for U.S. Markets in our daily chart, below.)
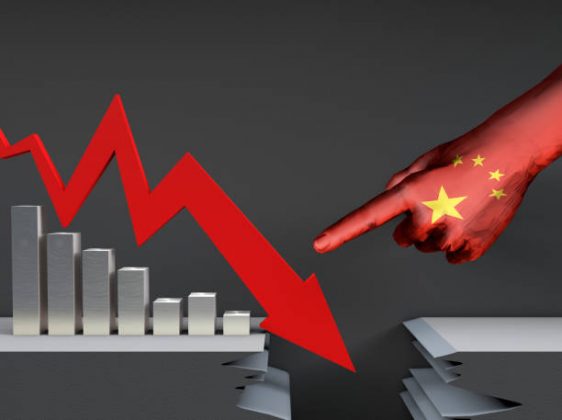
As for China, the trade negotiations are not the only wildcard. Growth is slowing in China, but it is still smoldering between 6-6.5%. John Jagerson, who pens our Chart Advisor newsletter and is one of our experts on Investing and Trading, points to China's Manufacturing Purchasers Index as a key indicator of China's economic health.  Here's John's take on China: "...For investors focused on China, January's manufacturing data was less-bad than expected but still in contraction territory. In order to avoid another economic debacle like the market experienced in 2015, Chinese economic data needs to improve. As you can see in the chart, the Manufacturing Purchasing Managers Index (PMI) for China has been in decline for months now. PMI readings below 50 indicate contraction. Because of the holiday, the next industrial production data is unscheduled, and PMI won't be out again until the end of February. Signs of recovery or weakness in China's trade balance, industrial production, or PMI numbers will be a key for understanding the potential for a repeat of 2015 so investors must stay alert for unexpected news. "
Caleb here - It's already hard to get good data out of China, but this month will be even more difficult given the holidays. Given that the trade negotiations are ongoing throughout the month, the pressure might be on Beijing to get a deal in place to avoid more contraction in manufacturing and slower growth than the 6-6.5% expected. Everything is connected.
Europe-Brexit Europe is complicated. The biggest single issue facing the continent and the EU is Brexit. With the March 29th deadline fast approaching for the U.K. to formally leave the EU, Prime Minister Theresa May, a leading proponent of Brexit, is hanging on to her post by a thread. She has survived two 'no confidence' votes in British Parliament, cabinet defections, complicated demands from the EU and Northern Ireland and public discord. An opposition party in Parliament tried and failed to postpone the March 29th exit date, so that is still the day to circle on the calendar.
Happy February!
Chart to Watch for February: S&P 500 
As you may have heard by now, the S&P 500 just had its best January since 1987. While this is a major feat by any measure, the starting point for January's rally was exceptionally low - more than 15% below September's all-time high. As of January's market close on Thursday, the index is now only around 8% below that September high. The big question now is, will stocks continue their momentum into February, or could we see a near-term ceiling on gains?
A quick look at the S&P 500 (SPX) daily chart above tells the whole story of December's sharp plunge and January's equally sharp rebound. As we look towards February, this rebound has just reached up to approach a relatively strong resistance point around the 2710-2715 price area, which is right around the 100-day moving average and a key 61.8% Fibonacci level (measured from September's all-time high down to the late December low).
Will February's market have enough juice to break through resistance and extend the rebound further? Strong corporate earnings and an increasingly dovish and accommodative Federal Reserve have been the primary drivers of the market rally in January. These are both strong fundamental drivers, but upside technical resistance is also strong. In February, the market move to watch will be whether or not the S&P 500 can surmount this resistance and potentially set the stage for a sustained move back up to resume the long-term bull trend. Or, a much less appealing scenario would be a February turn back down at or near resistance towards bear market territory once again. How can we improve the Market Sum? Tell us at marketsum@investopedia.com
Enjoy the Market Sum? Share it with a friend. Or share the link below to invite friends to sign up.
CONNECT WITH INVESTOPEDIA
Email sent to: mondemand.forex@blogger.com If you wish to unsubscribe, please click here, or manage subscriptions
114 West 41st St, floor 8 New York NY 10036 © 2018, Investopedia, LLC. All Rights Reserved | Privacy Policy |
